

Informed Opinion On Covid?

My wife and I were lamenting yesterday the glaring lack of transparency regarding SARS CoV-2 (i.e., Covid). I've long since come to the view that this lack of transparency on the part of most of our State and local governments and the public health authorities can only be explained by political motives. There's no health related reason why, at this point, we should not have access to the data that they have. Not to put too fine a point on it, Lib Prog fear mongering must be behind the lack of transparency. The fact of the matter is, you know and I know that--after months of the pandemic--there is no lack of relevant data out there, collected by government health officials. Yet somehow that relevant data is, for the most part, not being pushed out to the people (you and me) who need it to respond rationally. It's as if there are people or 'folks' who don't want us to know, who don't want us to be part of the decision making process.
Amid the talk of a new surge of "cases", I want to know what a "case" is, how that relates to hospitalizations and deaths, and who these people who have become "cases" actually are . More, I'd like to know how they became "cases."
Now along comes the State of Florida--and Avik Roy to explain what's going one there. Maybe this data--which unfortunately doesn't include data on contact tracing, the "how"--will suggest a rational course of action. I don't think Roy can be mistaken for a hardcore Trump apologist. This data raises serious questions about what's currently going on, both medically and politically. It's certainly a useful starting place for informed discussion:
If you want to understand what's going on with #COVID19 right now, the best place to look is Florida, because they do the best job of anyone in terms of data transparency. Note the different age distributions of cases, hospitalizations, & deaths in their regular report.
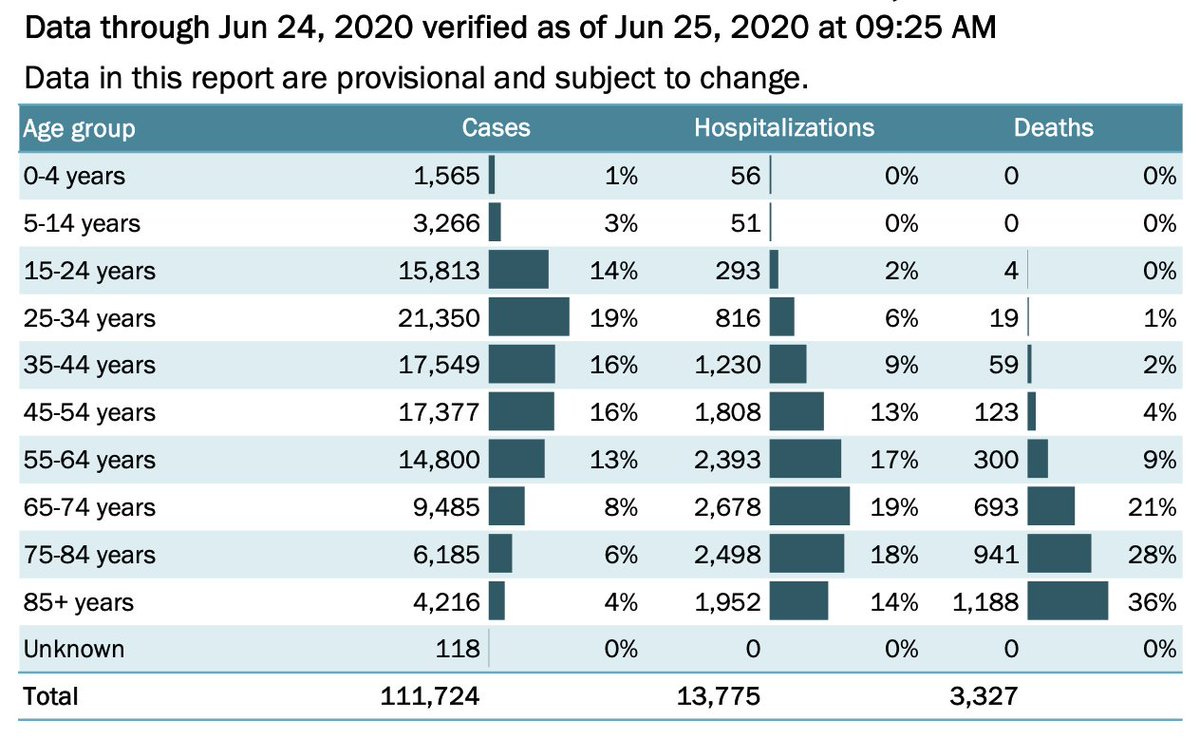
The full report is here: floridadisaster.org/globalassets/c… . The point is that not all hospitalizations are the same. If you're 85 and you've been hospitalized with #COVID19 , the risk of death is 61%. If you're 35-44, the risk is 5%. If you're 25-34, 2%.
So, when you see reports about rising numbers of hospitalizations, it's critical to ask: what's the age distribution of the people being hospitalized? We talking about elderly or young people? Without that information, "hospitalizations" statistics are far less useful.
For those who like to see this data visualized, here's a chart
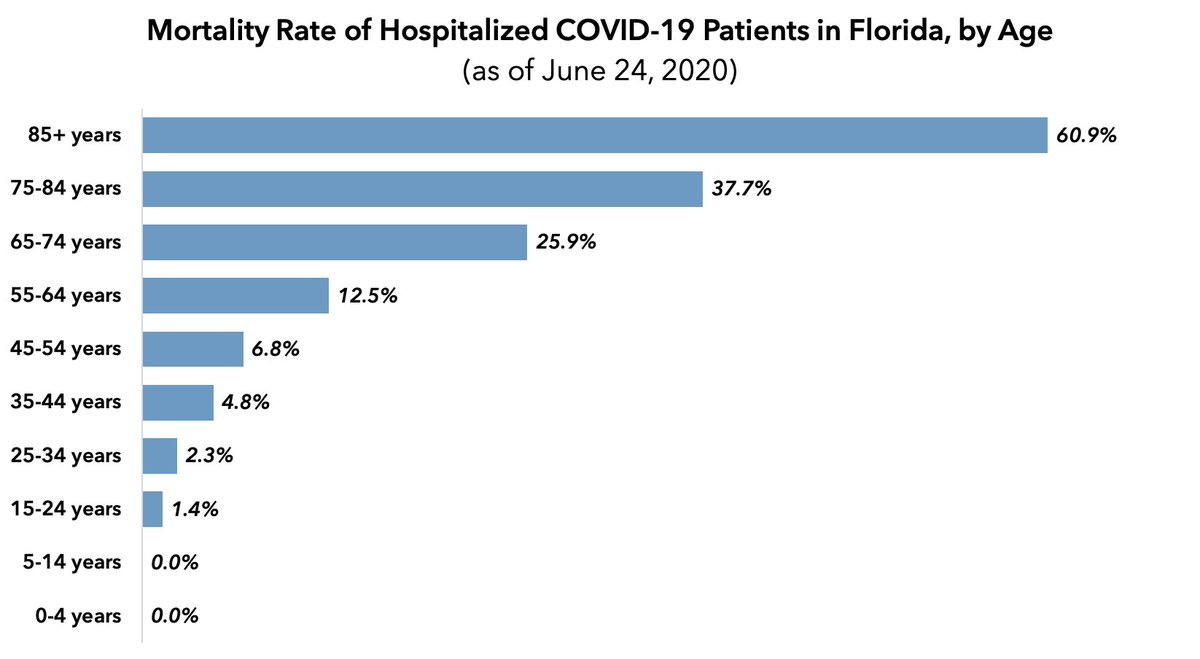
of the mortality rate of hospitalized #COVID19 patients by age bracket (in honor of UF grad @GreggGirvan the bars are in retro Gator blue). Not all COVID hospitalizations are created equal.
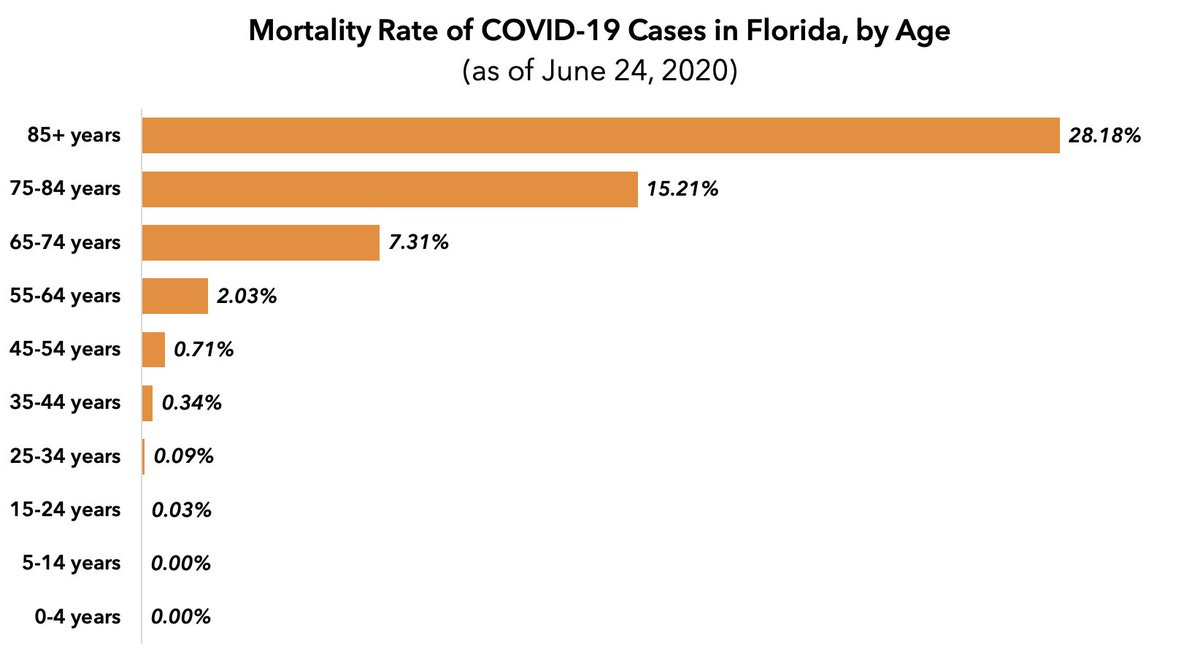
Here's a similar chart, but this time of the death rate for #COVID19 *cases* in FL. Age trend is even more pronounced, b/c the death rate for COVID *cases* for people under 55 is well below 1%. So when people talk about rising cases, 1st q to ask is: what's the age distribution?
Finally, here's the age distribution of the *hospitalization* rate of Florida #COVID19 cases. Here again, you see that the frequency of hospitalization is much higher for the elderly.
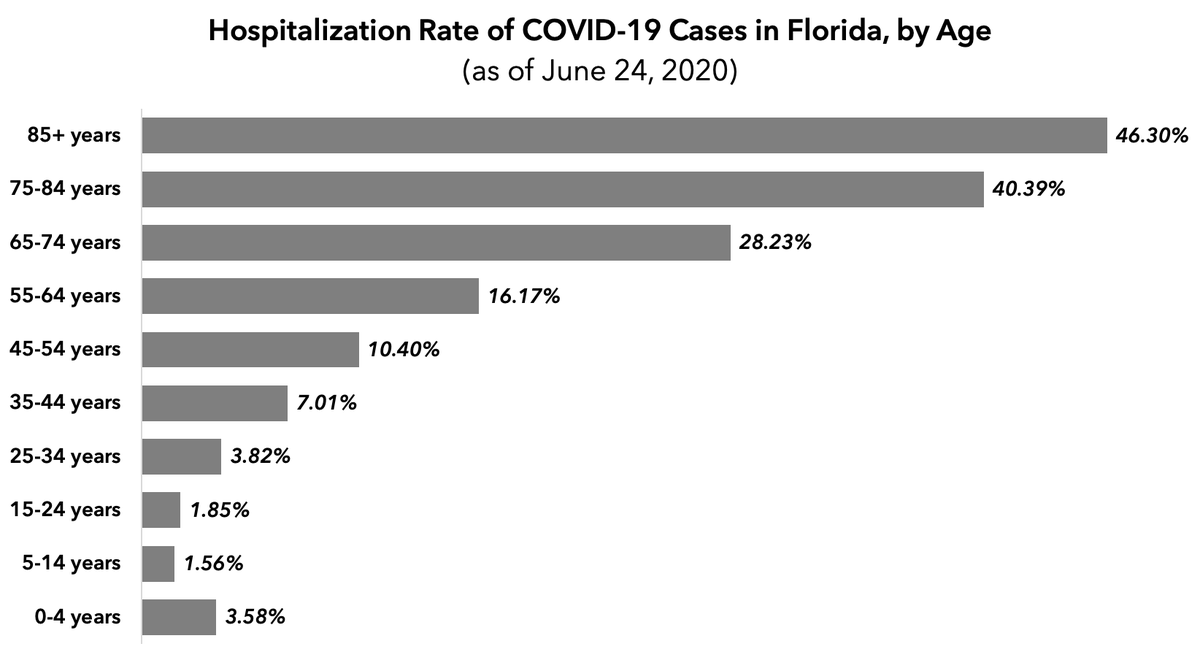
The reason I'm walking you through all of this is because the recent rise in hospitalizations in Florida is driven by younger people. This appears to be true in Texas as well, though I don't think we have data sources in Texas that break out the distribution as well as Florida's.