Parts of the article are quite technical. Well, there is some math, and just about any amount of that qualifies as “quite technical” for this writer. Nevertheless, the gist of it all is quite clear.
I offer this summary—and anyone interested, please follow the link—because there has been a steady drumbeat of comments here regarding these matters.
Let’s start with the first few paragraphs, which cuts to the heart of the sanctions war failure:
The war in Ukraine has exposed some serious misperceptions about the relative economic size and military power of major nations. Before the war, it was fashionable to say—usually sardonically—that Russia possessed an economy similar in size to that of Italy or smaller than that of Texas. “The Russian economy will be cut in half,” President Biden tweeted on March 26, 2022, “It was ranked the 11th biggest economy in the world before this invasion—and soon, it will not even rank among the top 20.”1
The statistics that the president used for this comparison were nominal GDP numbers measured in U.S. dollars. It is unclear why the president’s economic advisers did not direct him to the purchasing-power-parity-adjusted (PPP) GDP metrics, which are the standard tool economists use to compare the relative size of national economies. That statistic would have showed that Russia’s economy is the sixth largest in the world—almost as large as Germany’s and well over twice as large as the economy of Texas. Perhaps PPP-adjusted metrics have become embarrassing in D.C. of late as they show that the Chinese economy is roughly 20 percent larger than the American economy.
Yet this is only the first layer of a rather unsettling onion. In a previous essay, I pointed out that even PPP-adjusted GDP measures may be misleading when it comes to determining the relative importance of various economies.2 This argument is simple enough: not all GDP is created equal. A dollar of GDP generated by a casino is fundamentally different from a dollar of GDP generated by extracting oil. Since economies like China and Russia have far larger mining and manufacturing industries, their relative economic importance is far greater than even a PPP-adjusted GDP figure shows. This goes a long way toward explaining why the Western sanctions did not cut the Russian economy in half, as President Biden promised, but instead created a severe energy crisis in Europe—and the continent now faces the horrifying prospect of deindustrialization.
You get the picture. Pilkington goes on to apply those ideas to production and performance of military equipment. I can only give a very brief flavor for what he explains so, once, again, do yourself a favor—follow the link:
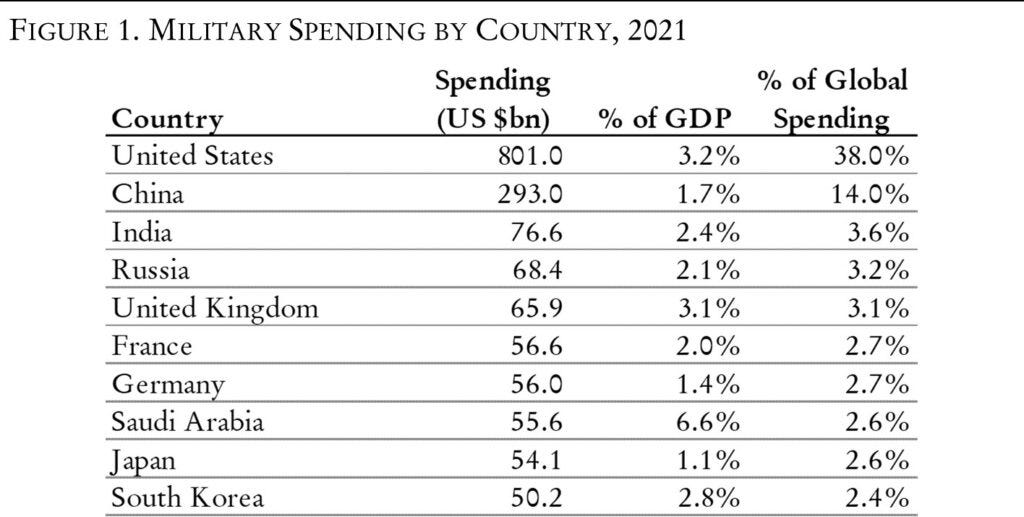
… Since the “end of history” was proclaimed after the Cold War, and peer-to-peer military competition seemed to recede, spending as a percentage of GDP is often the only measure of relative military power discussed in nonspecialist media.
Thus, the table below is one many have likely seen before. It shows overall military expenditure by country in nominal U.S. dollars for 2021.5 It also shows this spending represented as a percentage of each country’s GDP and as a percentage of total global military expenditure.
At first glance, this table seems to allow for an easy comparison of relative military strength among major world powers today. Yet a closer look at the actual military power of the countries listed reveals the severe limitations of these metrics. Let us examine Russia and the United Kingdom. If we look at the military expenditure in raw dollar terms, we will conclude that Russia and the United Kingdom are relatively similar in terms of military power. But anyone with even a cursory knowledge of the two militaries knows that this is almost certainly not the case.
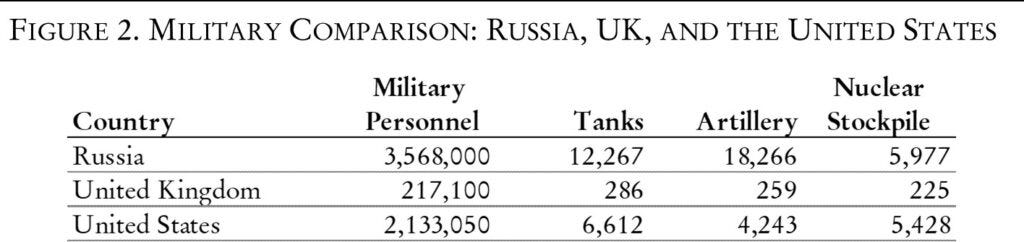
Let us compare these two militaries considering what we have learned from the Russo-Ukrainian war, the first interstate, large-scale land war in Europe since the Second World War. Figure 2 shows manpower, tanks, artillery pieces, and nuclear stockpiles (which allow a belligerent to deter conventional escalation past a certain point) for Russia, the United Kingdom, and the United States.6 Air power is certainly significant as well, but as the war in Ukraine shows, it is not necessarily decisive in a peer-to-peer conflict.
The results are shocking. Even though Russia and the United Kingdom spend approximately the same on their military in dollar terms, Russia has a military that is comparable to—if not substantially larger than—that of the United States. The United Kingdom is not even in the same league as Russia. This raises serious problems for measuring military strength by relative spending. Nor are these problems solved by using a PPP-adjusted metric. If we adjust Russian and British military spending for relative purchasing power, we get $149 billion for Russia versus $77.8 billion for the United Kingdom. True, this implies that Russia spends roughly twice what Britain spends on its military, but this does not explain the extreme differences between the Russian and British armed forces.
Of course, some of this can be explained by quality and some by stockpiles. Much of the Russian armaments, especially their nuclear weapons, are stockpiled from the Soviet Union. But the manpower differential cannot be explained in this way. Moreover, if past military expenditure contributes to current military strength, this only buttresses the case against using current expenditure measures to judge relative military power.
The use of macro metrics has also led to enormous complacency on the part of Western powers with respect to their capacity to reproduce stocks of basic ammunition. As we have seen in the comparison of the United Kingdom and Russia, large expenditures in no way guarantee the procurement of large quantities of the basic materiel needed for a functional military. This fact has been hammered home during the Russo-Ukrainian war. ...
Micro-Level Mischief
The problems do not stop there. Even if we accept that the macro military spending metrics are broken, and that standardized attempts to adjust them fail, we might nevertheless hold out hope for some sort of clever statistical fix. But this hope disintegrates when we zoom in to the micro level and find some rather disturbing discrepancies.
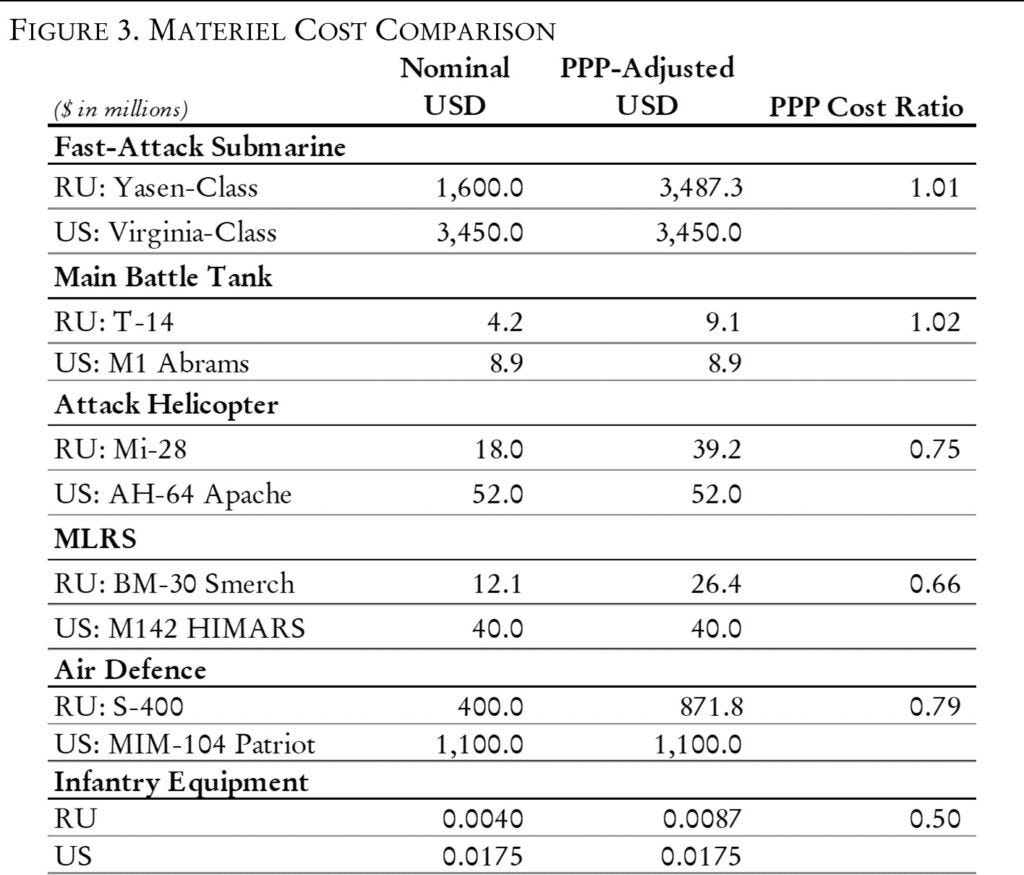
Let us compare two similar weapons systems and see what their relative prices tell us about military spending. The U.S. Virginia-class submarine is a relatively new class of nuclear-powered, fast attack submarine. Its Russian rival is called the Yasen class. Military analysts broadly agree that, while the two ships have their strengths and weaknesses, they are roughly evenly matched.9 But how about the cost? This is where things get interesting. The latest listed price for a Virginia-class submarine is around $3.45 billion per unit.10 Meanwhile, the Yasen-class submarines are estimated to cost around $1.6 billion per unit.11
If we adjust $1.6bn using a PPP metric, we arrive at a purchasing-price-parity cost of around $3.48 billion for the Yasen, almost identical to the price of the Virginia-class. This shows the undoubted power of the PPP framework—and it shows why nominal dollar estimates of military spending are extremely misleading. PPP adjustments may not work perfectly, but they provide us with a better basis of comparison than nominal dollar spending.
The question is whether this holds for all comparable materiel. In figure 3, I have attempted to compare materiel in various categories using publicly available information.12 I have also included PPP-adjusted results and have added a cost-ratio metric.
What we see is that PPP-adjustment sometimes makes the costs of these weapons systems comparable and sometimes does not. What stands out from our cost-ratio metric, however, is that when the PPP-adjustment fails, it always fails in one direction: that is, even when PPP-adjusted, Russian equipment tends to be cheaper than American equipment. This means that, when we aggregate up to total spending, even when using a PPP-adjusted measure, we likely underestimate Russian military potential.
That’s just a small part of the discussion. The article concludes with some math as applied to the economics of operating the US’s premier power projection tool around the world: The Carrier Battle Group. This is especially important for US operations in the Middle East—without CBGs the conventional US military presence would be a shadow of what it is, or seems to be, at present. So the question becomes, what is the survivability of the CBG—a fantastically expensive tool to build and operate—against the relatively inexpensive Russian hypersonic missiles—here, the Zircon. I’ll summarize.
Pilkington argues that, conservatively, we can assume that it would take 250 Zircons to sink a CBG (I wouldn’t count on that), “a probability of a single weapon sinking the carrier of 0.4 percent.” A good investment? Not so much.
In the case of our model, a Carrier Battle Group could only justify its cost if the probability of being sunk by a 3M22 Zircon was 0.04 percent—or, what amounts to the same thing, [if] it would take almost 2,400 3M22 Zircon missiles to sink a Carrier Battle Group. Perhaps more realistically, one could also adjust the value (or price) of the carrier group based on the fact that [a carrier group] can only be deployed in situations where the threat from hypersonic antiship missiles is minimal.
In other words, the US military is living on borrowed time, at least in terms of global power projection via the US Navy but also in terms of expeditionary war waging of almost any sort. Bear in mind, of course, that much of our shipping is nowhere near as well protected as CBG’s in an active war zone. In any event, the advent of hypersonic missiles has rendered a huge amount of our sunk (!) investment in power projection effectively obsolete—almost overnight. Realistically, it’s only the threat of nuclear war that has prevented that scenario from becoming a reality. I would argue that, as escalation increases in the direction of nuclear war, the parties involved will draw back from Armageddon, and yet that will lead to an increased threat to CBG’s anywhere close to a war zone. The more destruction the US wreaks, the more it escalates, the greater the possibility that a symmetrical response could involve destruction of a CBG—and going nuclear in response to that would be catastrophically asymmetrical. That, to me, tends strongly to militate against greater escalation beyond some yet to be determined point.
Again, follow the link, read it all.
Thanks for reading Meaning In History! Subscribe for free to receive new posts and support my work.
GDP is a funny thing. You can have country A, which does nothing but manufacture cars and country B, which has nothing but car dealerships to sell those cars, and country B will have a higher GDP than country A. Is only a useful tool when comparing apples to apples, which basically means almost never
1. The more you make, the more the production cost per unit goes down.
2. The US Military buys in a batch for some products, and then ends production waiting till a new version is developed. The Russians keep the production line going.
3. The effectiveness of Russian military equipment seems superior to Western Equipment, especially in the area of uptime and ease of maintenance. An example is the M1 tank the filters for the engine need to be cleaned daily. In Missile defense and Electronic Warfare the Russians are at least a generation ahead of the West.
4. For the 155 shell, the Russia is using 6X (I may remember wrong, it may be more) the amount of the Ukrainians. And the Ukrainians are being supported by the entire West, including South Korea.
5. In some areas of military equipment, the West has nothing compatible. Hypersonic missiles.
6.Europe is de-industrializing, it's not a matter of a possibility.


GDP is a funny thing. You can have country A, which does nothing but manufacture cars and country B, which has nothing but car dealerships to sell those cars, and country B will have a higher GDP than country A. Is only a useful tool when comparing apples to apples, which basically means almost never
Some guesses / swags:
1. The more you make, the more the production cost per unit goes down.
2. The US Military buys in a batch for some products, and then ends production waiting till a new version is developed. The Russians keep the production line going.
3. The effectiveness of Russian military equipment seems superior to Western Equipment, especially in the area of uptime and ease of maintenance. An example is the M1 tank the filters for the engine need to be cleaned daily. In Missile defense and Electronic Warfare the Russians are at least a generation ahead of the West.
4. For the 155 shell, the Russia is using 6X (I may remember wrong, it may be more) the amount of the Ukrainians. And the Ukrainians are being supported by the entire West, including South Korea.
5. In some areas of military equipment, the West has nothing compatible. Hypersonic missiles.
6.Europe is de-industrializing, it's not a matter of a possibility.